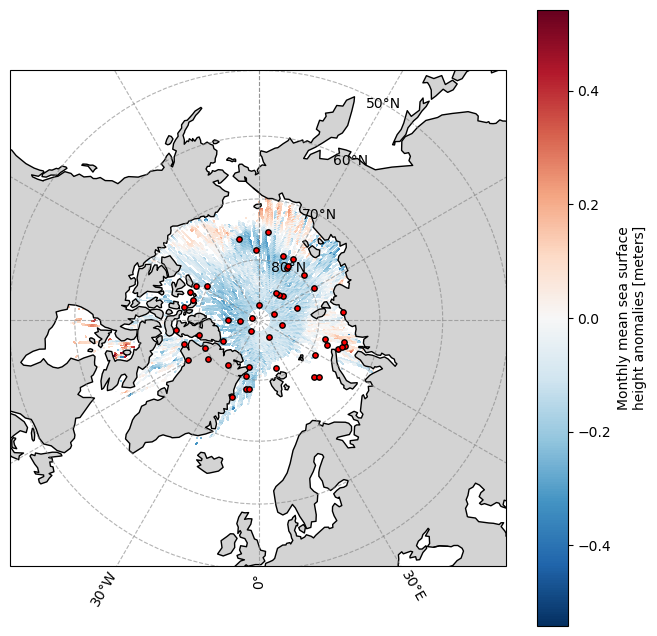
ATL21 is the gridded sea surface height anomaly (SSHA) product for the poles. Because it is a gridded product, we can use point-collocation to do matchups. Other ICESat-2 products like ATL07 are along track (lines) and point-collocation will not work for those data.
ATL21 has
Daily Arctic/Antarctic SSHA fields
Monthly averaged SSHA fields
The granules are h5 grouped netcdf files. It has monthly, daily, and metadata all in one netcdf. Because the points are in the far north (poles), we cannot use standard euclidean distance on lat/lon degrees. Read about point matchups near the poles here. We can pass in spatial_method="xoak-haversine" to use a distance metric designed for the globe and that works at the poles.
Note: In a virtual machine in AWS us-west-2, where NASA cloud data is, the point matchups are fast. In Colab, say, your compute is not in the same data region nor provider, and the same matchups might take 10x longer.
Prerequisites
The examples here use NASA EarthData and you need to have an account with EarthData. Make sure you can login.
# if needed!pipinstallpoint-collocationcartopy--quiet
importearthaccessearthaccess.login()
<earthaccess.auth.Auth at 0x7f3ee6b5dfd0>
Generate some points over the arctic
importnumpyasnpimportpandasaspdn_points=50# generate Arctic points (lat > 60)points=[]whilelen(points)<n_points:batch=500lat=np.degrees(np.arcsin(np.random.uniform(-1,1,batch)))lon=np.random.uniform(-180,180,batch)mask=lat>75forla,loinzip(lat[mask],lon[mask]):points.append((la,lo))iflen(points)>=n_points:breaklat,lon=np.array(points).T# random dates after Oct 2018start=pd.Timestamp("2018-10-01")end=pd.Timestamp.now()days=pd.date_range(start,end,freq="D")date=np.random.choice(days,n_points)# dataframedf=pd.DataFrame({"lat":lat,"lon":lon,"date":date})print(df.head())
Indicates if spot 1 is processed for the ATL21 product
flag_meanings :
not_processed processed
flag_values :
[0 1]
long_name :
Processing Flag for Spot 1 for ATL21
source :
Operations
units :
1
valid_max :
1
valid_min :
0
Array
Chunk
Bytes
1 B
1 B
Shape
(1,)
(1,)
Dask graph
1 chunks in 2 graph layers
Data type
int8 numpy.ndarray
proc_atl21_spot_2
(phony_dim_1)
int8
dask.array<chunksize=(1,), meta=np.ndarray>
contentType :
auxiliaryInformation
description :
Indicates if spot 2 is processed for the ATL21 product
flag_meanings :
not_processed processed
flag_values :
[0 1]
long_name :
Processing Flag for Spot 2 for ATL21
source :
Operations
units :
1
valid_max :
1
valid_min :
0
Array
Chunk
Bytes
1 B
1 B
Shape
(1,)
(1,)
Dask graph
1 chunks in 2 graph layers
Data type
int8 numpy.ndarray
proc_atl21_spot_3
(phony_dim_1)
int8
dask.array<chunksize=(1,), meta=np.ndarray>
contentType :
auxiliaryInformation
description :
Indicates if spot 3 is processed for the ATL21 product
flag_meanings :
not_processed processed
flag_values :
[0 1]
long_name :
Processing Flag for Spot 3 for ATL21
source :
Operations
units :
1
valid_max :
1
valid_min :
0
Array
Chunk
Bytes
1 B
1 B
Shape
(1,)
(1,)
Dask graph
1 chunks in 2 graph layers
Data type
int8 numpy.ndarray
proc_atl21_spot_4
(phony_dim_1)
int8
dask.array<chunksize=(1,), meta=np.ndarray>
contentType :
auxiliaryInformation
description :
Indicates if spot 4 is processed for the ATL21 product
flag_meanings :
not_processed processed
flag_values :
[0 1]
long_name :
Processing Flag for Spot 4 for ATL21
source :
Operations
units :
1
valid_max :
1
valid_min :
0
Array
Chunk
Bytes
1 B
1 B
Shape
(1,)
(1,)
Dask graph
1 chunks in 2 graph layers
Data type
int8 numpy.ndarray
proc_atl21_spot_5
(phony_dim_1)
int8
dask.array<chunksize=(1,), meta=np.ndarray>
contentType :
auxiliaryInformation
description :
Indicates if spot 5 is processed for the ATL21 product
flag_meanings :
not_processed processed
flag_values :
[0 1]
long_name :
Processing Flag for Spot 5 for ATL21
source :
Operations
units :
1
valid_max :
1
valid_min :
0
Array
Chunk
Bytes
1 B
1 B
Shape
(1,)
(1,)
Dask graph
1 chunks in 2 graph layers
Data type
int8 numpy.ndarray
proc_atl21_spot_6
(phony_dim_1)
int8
dask.array<chunksize=(1,), meta=np.ndarray>
contentType :
auxiliaryInformation
description :
Indicates if spot 6 is processed for the ATL21 product
flag_meanings :
not_processed processed
flag_values :
[0 1]
long_name :
Processing Flag for Spot 6 for ATL21
source :
Operations
units :
1
valid_max :
1
valid_min :
0
Array
Chunk
Bytes
1 B
1 B
Shape
(1,)
(1,)
Dask graph
1 chunks in 2 graph layers
Data type
int8 numpy.ndarray
description :
These parameters control which laser beam spots from ATL10 are included in the output ATL21.
/ancillary_data/refsurf_selection
grid_y: 448
grid_x: 304
phony_dim_0: 1
phony_dim_2: 1
process_refsurf_0
(phony_dim_2)
int8
dask.array<chunksize=(1,), meta=np.ndarray>
contentType :
auxiliaryInformation
description :
Indicates if reference surfaces with interpolation flag value of 0 is processed for the ATL21 product.
flag_meanings :
not_processed processed
flag_values :
[0 1]
long_name :
Processing Flag for Reference Surface type 0
source :
Operations
units :
1
valid_max :
1
valid_min :
0
Array
Chunk
Bytes
1 B
1 B
Shape
(1,)
(1,)
Dask graph
1 chunks in 2 graph layers
Data type
int8 numpy.ndarray
process_refsurf_1
(phony_dim_2)
int8
dask.array<chunksize=(1,), meta=np.ndarray>
contentType :
auxiliaryInformation
description :
Indicates if reference surfaces with interpolation flag value of 1 is processed for the ATL21 product.
flag_meanings :
not_processed processed
flag_values :
[0 1]
long_name :
Processing Flag for Reference Surface type 1
source :
Operations
units :
1
valid_max :
1
valid_min :
0
Array
Chunk
Bytes
1 B
1 B
Shape
(1,)
(1,)
Dask graph
1 chunks in 2 graph layers
Data type
int8 numpy.ndarray
process_refsurf_2
(phony_dim_2)
int8
dask.array<chunksize=(1,), meta=np.ndarray>
contentType :
auxiliaryInformation
description :
Indicates if reference surfaces with interpolation flag value of 2 is processed for the ATL21 product.
flag_meanings :
not_processed processed
flag_values :
[0 1]
long_name :
Processing Flag for Reference Surface type 2
source :
Operations
units :
1
valid_max :
1
valid_min :
0
Array
Chunk
Bytes
1 B
1 B
Shape
(1,)
(1,)
Dask graph
1 chunks in 2 graph layers
Data type
int8 numpy.ndarray
process_refsurf_3
(phony_dim_2)
int8
dask.array<chunksize=(1,), meta=np.ndarray>
contentType :
auxiliaryInformation
description :
Indicates if reference surfaces with interpolation flag value of 3 is processed for the ATL21 product.
flag_meanings :
not_processed processed
flag_values :
[0 1]
long_name :
Processing Flag for Reference Surface type 3
source :
Operations
units :
1
valid_max :
1
valid_min :
0
Array
Chunk
Bytes
1 B
1 B
Shape
(1,)
(1,)
Dask graph
1 chunks in 2 graph layers
Data type
int8 numpy.ndarray
description :
These parameters control which reference surfaces from ATL10 are included processing for the output ATL21. The selection of reference surface is determined using the beam_refsurf_interp_flag on ATL10 in group /gtx/freeboard_beam_segment/.
grid_y: 448
grid_x: 304
phony_dim_0: 1
atlas_sdp_gps_epoch
(phony_dim_0)
datetime64[ns]
dask.array<chunksize=(1,), meta=np.ndarray>
contentType :
auxiliaryInformation
description :
Number of GPS seconds between the GPS epoch (1980-01-06T00:00:00.000000Z UTC) and the ATLAS Standard Data Product (SDP) epoch (2018-01-01:T00.00.00.000000 UTC). Add this value to delta time parameters to compute full gps_seconds (relative to the GPS epoch) for each data point.
long_name :
ATLAS Epoch Offset
source :
Operations
Array
Chunk
Bytes
8 B
8 B
Shape
(1,)
(1,)
Dask graph
1 chunks in 2 graph layers
Data type
datetime64[ns] numpy.ndarray
control
(phony_dim_0)
|S100000
dask.array<chunksize=(1,), meta=np.ndarray>
contentType :
auxiliaryInformation
description :
PGE-specific control file used to generate this granule. To re-use, replace breaks (BR) with linefeeds.
long_name :
Control File
source :
Operations
units :
1
Array
Chunk
Bytes
97.66 kiB
97.66 kiB
Shape
(1,)
(1,)
Dask graph
1 chunks in 2 graph layers
Data type
|S100000 numpy.ndarray
data_end_utc
(phony_dim_0)
|S27
dask.array<chunksize=(1,), meta=np.ndarray>
contentType :
auxiliaryInformation
description :
UTC (in CCSDS-A format) of the last data point within the granule.
long_name :
End UTC Time of Granule (CCSDS-A, Actual)
source :
Derived
units :
1
Array
Chunk
Bytes
27 B
27 B
Shape
(1,)
(1,)
Dask graph
1 chunks in 2 graph layers
Data type
|S27 numpy.ndarray
data_start_utc
(phony_dim_0)
|S27
dask.array<chunksize=(1,), meta=np.ndarray>
contentType :
auxiliaryInformation
description :
UTC (in CCSDS-A format) of the first data point within the granule.
long_name :
Start UTC Time of Granule (CCSDS-A, Actual)
source :
Derived
units :
1
Array
Chunk
Bytes
27 B
27 B
Shape
(1,)
(1,)
Dask graph
1 chunks in 2 graph layers
Data type
|S27 numpy.ndarray
end_cycle
(phony_dim_0)
int32
dask.array<chunksize=(1,), meta=np.ndarray>
contentType :
auxiliaryInformation
description :
The ending cycle number associated with the data contained within this granule. The cycle number is the counter of the number of 91-day repeat cycles completed by the mission.
long_name :
Ending Cycle
source :
Derived
units :
1
valid_max :
99
valid_min :
0
Array
Chunk
Bytes
4 B
4 B
Shape
(1,)
(1,)
Dask graph
1 chunks in 2 graph layers
Data type
int32 numpy.ndarray
end_delta_time
(phony_dim_0)
datetime64[ns]
dask.array<chunksize=(1,), meta=np.ndarray>
contentType :
auxiliaryInformation
description :
Number of GPS seconds since the ATLAS SDP epoch at the last data point in the file. The ATLAS Standard Data Products (SDP) epoch offset is defined within /ancillary_data/atlas_sdp_gps_epoch as the number of GPS seconds between the GPS epoch (1980-01-06T00:00:00.000000Z UTC) and the ATLAS SDP epoch. By adding the offset contained within atlas_sdp_gps_epoch to delta time parameters, the time in gps_seconds relative to the GPS epoch can be computed.
long_name :
ATLAS End Time (Actual)
source :
Derived
standard_name :
time
Array
Chunk
Bytes
8 B
8 B
Shape
(1,)
(1,)
Dask graph
1 chunks in 2 graph layers
Data type
datetime64[ns] numpy.ndarray
end_geoseg
(phony_dim_0)
int32
dask.array<chunksize=(1,), meta=np.ndarray>
contentType :
auxiliaryInformation
description :
The ending geolocation segment number associated with the data contained within this granule. ICESat-2 granule geographic regions are further refined by geolocation segments. During the geolocation process, a geolocation segment is created approximately every 20m from the start of the orbit to the end. The geolocation segments help align the ATLAS strong a weak beams and provide a common segment length for the L2 and higher products. The geolocation segment indices differ slightly from orbit-to-orbit because of the irregular shape of the Earth. The geolocation segment indices on ATL01 and ATL02 are only approximate because beams have not been aligned at the time of their creation.
long_name :
Ending Geolocation Segment
source :
Derived
units :
1
Array
Chunk
Bytes
4 B
4 B
Shape
(1,)
(1,)
Dask graph
1 chunks in 2 graph layers
Data type
int32 numpy.ndarray
end_gpssow
(phony_dim_0)
float64
dask.array<chunksize=(1,), meta=np.ndarray>
contentType :
auxiliaryInformation
description :
GPS seconds-of-week of the last data point in the granule.
long_name :
Ending GPS SOW of Granule (Actual)
source :
Derived
units :
seconds
Array
Chunk
Bytes
8 B
8 B
Shape
(1,)
(1,)
Dask graph
1 chunks in 2 graph layers
Data type
float64 numpy.ndarray
end_gpsweek
(phony_dim_0)
int32
dask.array<chunksize=(1,), meta=np.ndarray>
contentType :
auxiliaryInformation
description :
GPS week number of the last data point in the granule.
long_name :
Ending GPSWeek of Granule (Actual)
source :
Derived
units :
weeks from 1980-01-06
Array
Chunk
Bytes
4 B
4 B
Shape
(1,)
(1,)
Dask graph
1 chunks in 2 graph layers
Data type
int32 numpy.ndarray
end_orbit
(phony_dim_0)
int32
dask.array<chunksize=(1,), meta=np.ndarray>
contentType :
auxiliaryInformation
description :
The ending orbit number associated with the data contained within this granule. The orbit number increments each time the spacecraft completes a full orbit of the Earth.
long_name :
Ending Orbit Number
source :
Derived
units :
1
Array
Chunk
Bytes
4 B
4 B
Shape
(1,)
(1,)
Dask graph
1 chunks in 2 graph layers
Data type
int32 numpy.ndarray
end_region
(phony_dim_0)
int32
dask.array<chunksize=(1,), meta=np.ndarray>
contentType :
auxiliaryInformation
description :
The ending product-specific region number associated with the data contained within this granule. ICESat-2 data products are separated by geographic regions. The data contained within a specific region are the same for ATL01 and ATL02. ATL03 regions differ slightly because of different geolocation segment locations caused by the irregular shape of the Earth. The region indices for other products are completely independent.
long_name :
Ending Region
source :
Derived
units :
1
Array
Chunk
Bytes
4 B
4 B
Shape
(1,)
(1,)
Dask graph
1 chunks in 2 graph layers
Data type
int32 numpy.ndarray
end_rgt
(phony_dim_0)
int32
dask.array<chunksize=(1,), meta=np.ndarray>
contentType :
auxiliaryInformation
description :
The ending reference groundtrack (RGT) number associated with the data contained within this granule. There are 1387 reference groundtrack in the ICESat-2 repeat orbit. The reference groundtrack increments each time the spacecraft completes a full orbit of the Earth and resets to 1 each time the spacecraft completes a full cycle.
long_name :
Ending Reference Groundtrack
source :
Derived
units :
1
valid_max :
1387
valid_min :
1
Array
Chunk
Bytes
4 B
4 B
Shape
(1,)
(1,)
Dask graph
1 chunks in 2 graph layers
Data type
int32 numpy.ndarray
granule_end_utc
(phony_dim_0)
|S27
dask.array<chunksize=(1,), meta=np.ndarray>
contentType :
auxiliaryInformation
description :
Requested end time (in UTC CCSDS-A) of this granule.
long_name :
End UTC Time of Granule (CCSDS-A, Requested)
source :
Derived
units :
1
Array
Chunk
Bytes
27 B
27 B
Shape
(1,)
(1,)
Dask graph
1 chunks in 2 graph layers
Data type
|S27 numpy.ndarray
granule_start_utc
(phony_dim_0)
|S27
dask.array<chunksize=(1,), meta=np.ndarray>
contentType :
auxiliaryInformation
description :
Requested start time (in UTC CCSDS-A) of this granule.
long_name :
Start UTC Time of Granule (CCSDS-A, Requested)
source :
Derived
units :
1
Array
Chunk
Bytes
27 B
27 B
Shape
(1,)
(1,)
Dask graph
1 chunks in 2 graph layers
Data type
|S27 numpy.ndarray
release
(phony_dim_0)
|S80
dask.array<chunksize=(1,), meta=np.ndarray>
contentType :
auxiliaryInformation
description :
Release number of the granule. The release number is incremented when the software or ancillary data used to create the granule has been changed.
long_name :
Release Number
source :
Operations
units :
1
Array
Chunk
Bytes
80 B
80 B
Shape
(1,)
(1,)
Dask graph
1 chunks in 2 graph layers
Data type
|S80 numpy.ndarray
start_cycle
(phony_dim_0)
int32
dask.array<chunksize=(1,), meta=np.ndarray>
contentType :
auxiliaryInformation
description :
The starting cycle number associated with the data contained within this granule. The cycle number is the counter of the number of 91-day repeat cycles completed by the mission.
long_name :
Starting Cycle
source :
Derived
units :
1
valid_max :
99
valid_min :
0
Array
Chunk
Bytes
4 B
4 B
Shape
(1,)
(1,)
Dask graph
1 chunks in 2 graph layers
Data type
int32 numpy.ndarray
start_delta_time
(phony_dim_0)
datetime64[ns]
dask.array<chunksize=(1,), meta=np.ndarray>
contentType :
auxiliaryInformation
description :
Number of GPS seconds since the ATLAS SDP epoch at the first data point in the file. The ATLAS Standard Data Products (SDP) epoch offset is defined within /ancillary_data/atlas_sdp_gps_epoch as the number of GPS seconds between the GPS epoch (1980-01-06T00:00:00.000000Z UTC) and the ATLAS SDP epoch. By adding the offset contained within atlas_sdp_gps_epoch to delta time parameters, the time in gps_seconds relative to the GPS epoch can be computed.
long_name :
ATLAS Start Time (Actual)
source :
Derived
standard_name :
time
Array
Chunk
Bytes
8 B
8 B
Shape
(1,)
(1,)
Dask graph
1 chunks in 2 graph layers
Data type
datetime64[ns] numpy.ndarray
start_geoseg
(phony_dim_0)
int32
dask.array<chunksize=(1,), meta=np.ndarray>
contentType :
auxiliaryInformation
description :
The starting geolocation segment number associated with the data contained within this granule. ICESat-2 granule geographic regions are further refined by geolocation segments. During the geolocation process, a geolocation segment is created approximately every 20m from the start of the orbit to the end. The geolocation segments help align the ATLAS strong a weak beams and provide a common segment length for the L2 and higher products. The geolocation segment indices differ slightly from orbit-to-orbit because of the irregular shape of the Earth. The geolocation segment indices on ATL01 and ATL02 are only approximate because beams have not been aligned at the time of their creation.
long_name :
Starting Geolocation Segment
source :
Derived
units :
1
Array
Chunk
Bytes
4 B
4 B
Shape
(1,)
(1,)
Dask graph
1 chunks in 2 graph layers
Data type
int32 numpy.ndarray
start_gpssow
(phony_dim_0)
float64
dask.array<chunksize=(1,), meta=np.ndarray>
contentType :
auxiliaryInformation
description :
GPS seconds-of-week of the first data point in the granule.
long_name :
Start GPS SOW of Granule (Actual)
source :
Derived
units :
seconds
Array
Chunk
Bytes
8 B
8 B
Shape
(1,)
(1,)
Dask graph
1 chunks in 2 graph layers
Data type
float64 numpy.ndarray
start_gpsweek
(phony_dim_0)
int32
dask.array<chunksize=(1,), meta=np.ndarray>
contentType :
auxiliaryInformation
description :
GPS week number of the first data point in the granule.
long_name :
Start GPSWeek of Granule (Actual)
source :
Derived
units :
weeks from 1980-01-06
Array
Chunk
Bytes
4 B
4 B
Shape
(1,)
(1,)
Dask graph
1 chunks in 2 graph layers
Data type
int32 numpy.ndarray
start_orbit
(phony_dim_0)
int32
dask.array<chunksize=(1,), meta=np.ndarray>
contentType :
auxiliaryInformation
description :
The starting orbit number associated with the data contained within this granule. The orbit number increments each time the spacecraft completes a full orbit of the Earth.
long_name :
Starting Orbit Number
source :
Derived
units :
1
Array
Chunk
Bytes
4 B
4 B
Shape
(1,)
(1,)
Dask graph
1 chunks in 2 graph layers
Data type
int32 numpy.ndarray
start_region
(phony_dim_0)
int32
dask.array<chunksize=(1,), meta=np.ndarray>
contentType :
auxiliaryInformation
description :
The starting product-specific region number associated with the data contained within this granule. ICESat-2 data products are separated by geographic regions. The data contained within a specific region are the same for ATL01 and ATL02. ATL03 regions differ slightly because of different geolocation segment locations caused by the irregular shape of the Earth. The region indices for other products are completely independent.
long_name :
Starting Region
source :
Derived
units :
1
Array
Chunk
Bytes
4 B
4 B
Shape
(1,)
(1,)
Dask graph
1 chunks in 2 graph layers
Data type
int32 numpy.ndarray
start_rgt
(phony_dim_0)
int32
dask.array<chunksize=(1,), meta=np.ndarray>
contentType :
auxiliaryInformation
description :
The starting reference groundtrack (RGT) number associated with the data contained within this granule. There are 1387 reference groundtrack in the ICESat-2 repeat orbit. The reference groundtrack increments each time the spacecraft completes a full orbit of the Earth and resets to 1 each time the spacecraft completes a full cycle.
long_name :
Starting Reference Groundtrack
source :
Derived
units :
1
valid_max :
1387
valid_min :
1
Array
Chunk
Bytes
4 B
4 B
Shape
(1,)
(1,)
Dask graph
1 chunks in 2 graph layers
Data type
int32 numpy.ndarray
version
(phony_dim_0)
|S80
dask.array<chunksize=(1,), meta=np.ndarray>
contentType :
auxiliaryInformation
description :
Version number of this granule within the release. It is a sequential number corresponding to the number of times the granule has been reprocessed for the current release.
long_name :
Version
source :
Operations
units :
1
Array
Chunk
Bytes
80 B
80 B
Shape
(1,)
(1,)
Dask graph
1 chunks in 2 graph layers
Data type
|S80 numpy.ndarray
description :
Contains information ancillary to the data product. This may include product characteristics, instrument characteristics and/or processing constants.
/daily
(6/31)
/daily/day01
grid_y: 448
grid_x: 304
phony_dim_3: 1
delta_time_beg
(phony_dim_3)
datetime64[ns]
dask.array<chunksize=(1,), meta=np.ndarray>
contentType :
modelResult
description :
Center time of the first reference surface used in this gridded composite in seconds since the ATLAS SDP GPS Epoch. The ATLAS Standard Data Products (SDP) epoch offset is defined within /ancillary_data/atlas_sdp_gps_epoch as the number of GPS seconds between the GPS epoch (1980-01-06T00:00:00.000000Z UTC) and the ATLAS SDP epoch. By adding the offset contained within atlas_sdp_gps_epoch to delta time parameters, the time in gps_seconds relative to the GPS epoch can be computed.
long_name :
Elapsed GPS seconds
source :
Derived via Time Tagging
standard_name :
time
Array
Chunk
Bytes
8 B
8 B
Shape
(1,)
(1,)
Dask graph
1 chunks in 2 graph layers
Data type
datetime64[ns] numpy.ndarray
delta_time_end
(phony_dim_3)
datetime64[ns]
dask.array<chunksize=(1,), meta=np.ndarray>
contentType :
modelResult
description :
Center time of the last reference surface used in this gridded composite in seconds since the ATLAS SDP GPS Epoch. The ATLAS Standard Data Products (SDP) epoch offset is defined within /ancillary_data/atlas_sdp_gps_epoch as the number of GPS seconds between the GPS epoch (1980-01-06T00:00:00.000000Z UTC) and the ATLAS SDP epoch. By adding the offset contained within atlas_sdp_gps_epoch to delta time parameters, the time in gps_seconds relative to the GPS epoch can be computed.
long_name :
Elapsed GPS seconds
source :
Derived via Time Tagging
standard_name :
time
Array
Chunk
Bytes
8 B
8 B
Shape
(1,)
(1,)
Dask graph
1 chunks in 2 graph layers
Data type
datetime64[ns] numpy.ndarray
mean_ssha
(grid_y, grid_x)
float32
dask.array<chunksize=(448, 304), meta=np.ndarray>
contentType :
modelResult
description :
Daily mean sea surface height anomalies (SSHA) for each daily grid cell. Sea surface height anomalies expressed relative to the mean sea surface (other geophysical corrections also applied, as indicated in the ATBD) using the reference surface heights.
grid_mapping :
crs
long_name :
Daily mean sea surface height anomalies
source :
Sea Ice ATBD
units :
meters
Array
Chunk
Bytes
532.00 kiB
532.00 kiB
Shape
(448, 304)
(448, 304)
Dask graph
1 chunks in 2 graph layers
Data type
float32 numpy.ndarray
mean_weighted_earth_free2mean
(grid_y, grid_x)
float32
dask.array<chunksize=(448, 304), meta=np.ndarray>
contentType :
modelResult
description :
Mean of the solid earth permanent tide correction (height_segment_earth_free2mean in ATL10) sampled at each reference surface height location used in the daily grid cell. Subtract from mean_ssha to remove the solid earth permanent tide.
grid_mapping :
crs
long_name :
Daily mean solid earth tide free-to-mean conversion
source :
Sea Ice ATBD
standard_name :
solid earth tide free2mean
units :
meters
Array
Chunk
Bytes
532.00 kiB
532.00 kiB
Shape
(448, 304)
(448, 304)
Dask graph
1 chunks in 2 graph layers
Data type
float32 numpy.ndarray
mean_weighted_geoid
(grid_y, grid_x)
float32
dask.array<chunksize=(448, 304), meta=np.ndarray>
contentType :
modelResult
description :
Mean of the geoid values (height_segment_geoid in ATL10) sampled at each reference surface height location used in the daily grid cell. Geoid is expressed relative to the WGS-84 reference ellipsoid from EGM2008 and is in a mean-tide system.
grid_mapping :
crs
long_name :
Daily mean geoid
source :
Sea Ice ATBD
units :
meters
Array
Chunk
Bytes
532.00 kiB
532.00 kiB
Shape
(448, 304)
(448, 304)
Dask graph
1 chunks in 2 graph layers
Data type
float32 numpy.ndarray
mean_weighted_geoid_free2mean
(grid_y, grid_x)
float32
dask.array<chunksize=(448, 304), meta=np.ndarray>
contentType :
modelResult
description :
Mean of the geoid free-to-mean correction (height_segment_geoid_free2mean in ATL10) sampled at each reference surface height location used in the daily grid cell. Subtract from mean_weighted_mss or mean_weighted_geoid to convert to a tide-free system.
grid_mapping :
crs
long_name :
Daily mean geoid free-to-mean conversion
source :
Sea Ice ATBD
standard_name :
geoid free2mean
units :
meters
Array
Chunk
Bytes
532.00 kiB
532.00 kiB
Shape
(448, 304)
(448, 304)
Dask graph
1 chunks in 2 graph layers
Data type
float32 numpy.ndarray
mean_weighted_mss
(grid_y, grid_x)
float32
dask.array<chunksize=(448, 304), meta=np.ndarray>
contentType :
modelResult
description :
Grid-cell mean of the Mean Sea Surface (MSS) values sampled at each reference surface height location used in the daily grid cell. MSS in ATL10 is expressed relative to the WGS-84 reference ellipsoid from a CryoSat-2/DTU13 merged product (https://doi.org/10. 5281/zenodo.4294047) and is in a tide free system. MSS is converted to mean tide when sampled by ATL21 using the geoid_free2mean correction.
grid_mapping :
crs
long_name :
Daily mean MSS
source :
Sea Ice ATBD
units :
meters
Array
Chunk
Bytes
532.00 kiB
532.00 kiB
Shape
(448, 304)
(448, 304)
Dask graph
1 chunks in 2 graph layers
Data type
float32 numpy.ndarray
n_refsurfs
(grid_y, grid_x)
float64
dask.array<chunksize=(448, 304), meta=np.ndarray>
contentType :
modelResult
description :
Number of reference surface sections used in each daily grid cell.
grid_mapping :
crs
long_name :
Daily population count
source :
Sea Ice ATBD
units :
1
Array
Chunk
Bytes
1.04 MiB
1.04 MiB
Shape
(448, 304)
(448, 304)
Dask graph
1 chunks in 2 graph layers
Data type
float64 numpy.ndarray
sigma
(grid_y, grid_x)
float32
dask.array<chunksize=(448, 304), meta=np.ndarray>
contentType :
modelResult
description :
Standard deviation of daily gridded mean sea surface height anomaly, computed following ATBD section 6.3.
grid_mapping :
crs
long_name :
Daily standard deviation
source :
Sea Ice ATBD
units :
meters
Array
Chunk
Bytes
532.00 kiB
532.00 kiB
Shape
(448, 304)
(448, 304)
Dask graph
1 chunks in 2 graph layers
Data type
float32 numpy.ndarray
description :
Gridded daily averages
/daily/day02
grid_y: 448
grid_x: 304
phony_dim_4: 1
delta_time_beg
(phony_dim_4)
datetime64[ns]
dask.array<chunksize=(1,), meta=np.ndarray>
contentType :
modelResult
description :
Center time of the first reference surface used in this gridded composite in seconds since the ATLAS SDP GPS Epoch. The ATLAS Standard Data Products (SDP) epoch offset is defined within /ancillary_data/atlas_sdp_gps_epoch as the number of GPS seconds between the GPS epoch (1980-01-06T00:00:00.000000Z UTC) and the ATLAS SDP epoch. By adding the offset contained within atlas_sdp_gps_epoch to delta time parameters, the time in gps_seconds relative to the GPS epoch can be computed.
long_name :
Elapsed GPS seconds
source :
Derived via Time Tagging
standard_name :
time
Array
Chunk
Bytes
8 B
8 B
Shape
(1,)
(1,)
Dask graph
1 chunks in 2 graph layers
Data type
datetime64[ns] numpy.ndarray
delta_time_end
(phony_dim_4)
datetime64[ns]
dask.array<chunksize=(1,), meta=np.ndarray>
contentType :
modelResult
description :
Center time of the last reference surface used in this gridded composite in seconds since the ATLAS SDP GPS Epoch. The ATLAS Standard Data Products (SDP) epoch offset is defined within /ancillary_data/atlas_sdp_gps_epoch as the number of GPS seconds between the GPS epoch (1980-01-06T00:00:00.000000Z UTC) and the ATLAS SDP epoch. By adding the offset contained within atlas_sdp_gps_epoch to delta time parameters, the time in gps_seconds relative to the GPS epoch can be computed.
long_name :
Elapsed GPS seconds
source :
Derived via Time Tagging
standard_name :
time
Array
Chunk
Bytes
8 B
8 B
Shape
(1,)
(1,)
Dask graph
1 chunks in 2 graph layers
Data type
datetime64[ns] numpy.ndarray
mean_ssha
(grid_y, grid_x)
float32
dask.array<chunksize=(448, 304), meta=np.ndarray>
contentType :
modelResult
description :
Daily mean sea surface height anomalies (SSHA) for each daily grid cell. Sea surface height anomalies expressed relative to the mean sea surface (other geophysical corrections also applied, as indicated in the ATBD) using the reference surface heights.
grid_mapping :
crs
long_name :
Daily mean sea surface height anomalies
source :
Sea Ice ATBD
units :
meters
Array
Chunk
Bytes
532.00 kiB
532.00 kiB
Shape
(448, 304)
(448, 304)
Dask graph
1 chunks in 2 graph layers
Data type
float32 numpy.ndarray
mean_weighted_earth_free2mean
(grid_y, grid_x)
float32
dask.array<chunksize=(448, 304), meta=np.ndarray>
contentType :
modelResult
description :
Mean of the solid earth permanent tide correction (height_segment_earth_free2mean in ATL10) sampled at each reference surface height location used in the daily grid cell. Subtract from mean_ssha to remove the solid earth permanent tide.
grid_mapping :
crs
long_name :
Daily mean solid earth tide free-to-mean conversion
source :
Sea Ice ATBD
standard_name :
solid earth tide free2mean
units :
meters
Array
Chunk
Bytes
532.00 kiB
532.00 kiB
Shape
(448, 304)
(448, 304)
Dask graph
1 chunks in 2 graph layers
Data type
float32 numpy.ndarray
mean_weighted_geoid
(grid_y, grid_x)
float32
dask.array<chunksize=(448, 304), meta=np.ndarray>
contentType :
modelResult
description :
Mean of the geoid values (height_segment_geoid in ATL10) sampled at each reference surface height location used in the daily grid cell. Geoid is expressed relative to the WGS-84 reference ellipsoid from EGM2008 and is in a mean-tide system.
grid_mapping :
crs
long_name :
Daily mean geoid
source :
Sea Ice ATBD
units :
meters
Array
Chunk
Bytes
532.00 kiB
532.00 kiB
Shape
(448, 304)
(448, 304)
Dask graph
1 chunks in 2 graph layers
Data type
float32 numpy.ndarray
mean_weighted_geoid_free2mean
(grid_y, grid_x)
float32
dask.array<chunksize=(448, 304), meta=np.ndarray>
contentType :
modelResult
description :
Mean of the geoid free-to-mean correction (height_segment_geoid_free2mean in ATL10) sampled at each reference surface height location used in the daily grid cell. Subtract from mean_weighted_mss or mean_weighted_geoid to convert to a tide-free system.
grid_mapping :
crs
long_name :
Daily mean geoid free-to-mean conversion
source :
Sea Ice ATBD
standard_name :
geoid free2mean
units :
meters
Array
Chunk
Bytes
532.00 kiB
532.00 kiB
Shape
(448, 304)
(448, 304)
Dask graph
1 chunks in 2 graph layers
Data type
float32 numpy.ndarray
mean_weighted_mss
(grid_y, grid_x)
float32
dask.array<chunksize=(448, 304), meta=np.ndarray>
contentType :
modelResult
description :
Grid-cell mean of the Mean Sea Surface (MSS) values sampled at each reference surface height location used in the daily grid cell. MSS in ATL10 is expressed relative to the WGS-84 reference ellipsoid from a CryoSat-2/DTU13 merged product (https://doi.org/10. 5281/zenodo.4294047) and is in a tide free system. MSS is converted to mean tide when sampled by ATL21 using the geoid_free2mean correction.
grid_mapping :
crs
long_name :
Daily mean MSS
source :
Sea Ice ATBD
units :
meters
Array
Chunk
Bytes
532.00 kiB
532.00 kiB
Shape
(448, 304)
(448, 304)
Dask graph
1 chunks in 2 graph layers
Data type
float32 numpy.ndarray
n_refsurfs
(grid_y, grid_x)
float64
dask.array<chunksize=(448, 304), meta=np.ndarray>
contentType :
modelResult
description :
Number of reference surface sections used in each daily grid cell.
grid_mapping :
crs
long_name :
Daily population count
source :
Sea Ice ATBD
units :
1
Array
Chunk
Bytes
1.04 MiB
1.04 MiB
Shape
(448, 304)
(448, 304)
Dask graph
1 chunks in 2 graph layers
Data type
float64 numpy.ndarray
sigma
(grid_y, grid_x)
float32
dask.array<chunksize=(448, 304), meta=np.ndarray>
contentType :
modelResult
description :
Standard deviation of daily gridded mean sea surface height anomaly, computed following ATBD section 6.3.
grid_mapping :
crs
long_name :
Daily standard deviation
source :
Sea Ice ATBD
units :
meters
Array
Chunk
Bytes
532.00 kiB
532.00 kiB
Shape
(448, 304)
(448, 304)
Dask graph
1 chunks in 2 graph layers
Data type
float32 numpy.ndarray
description :
Gridded daily averages
/daily/day03
grid_y: 448
grid_x: 304
phony_dim_5: 1
delta_time_beg
(phony_dim_5)
datetime64[ns]
dask.array<chunksize=(1,), meta=np.ndarray>
contentType :
modelResult
description :
Center time of the first reference surface used in this gridded composite in seconds since the ATLAS SDP GPS Epoch. The ATLAS Standard Data Products (SDP) epoch offset is defined within /ancillary_data/atlas_sdp_gps_epoch as the number of GPS seconds between the GPS epoch (1980-01-06T00:00:00.000000Z UTC) and the ATLAS SDP epoch. By adding the offset contained within atlas_sdp_gps_epoch to delta time parameters, the time in gps_seconds relative to the GPS epoch can be computed.
long_name :
Elapsed GPS seconds
source :
Derived via Time Tagging
standard_name :
time
Array
Chunk
Bytes
8 B
8 B
Shape
(1,)
(1,)
Dask graph
1 chunks in 2 graph layers
Data type
datetime64[ns] numpy.ndarray
delta_time_end
(phony_dim_5)
datetime64[ns]
dask.array<chunksize=(1,), meta=np.ndarray>
contentType :
modelResult
description :
Center time of the last reference surface used in this gridded composite in seconds since the ATLAS SDP GPS Epoch. The ATLAS Standard Data Products (SDP) epoch offset is defined within /ancillary_data/atlas_sdp_gps_epoch as the number of GPS seconds between the GPS epoch (1980-01-06T00:00:00.000000Z UTC) and the ATLAS SDP epoch. By adding the offset contained within atlas_sdp_gps_epoch to delta time parameters, the time in gps_seconds relative to the GPS epoch can be computed.
long_name :
Elapsed GPS seconds
source :
Derived via Time Tagging
standard_name :
time
Array
Chunk
Bytes
8 B
8 B
Shape
(1,)
(1,)
Dask graph
1 chunks in 2 graph layers
Data type
datetime64[ns] numpy.ndarray
mean_ssha
(grid_y, grid_x)
float32
dask.array<chunksize=(448, 304), meta=np.ndarray>
contentType :
modelResult
description :
Daily mean sea surface height anomalies (SSHA) for each daily grid cell. Sea surface height anomalies expressed relative to the mean sea surface (other geophysical corrections also applied, as indicated in the ATBD) using the reference surface heights.
grid_mapping :
crs
long_name :
Daily mean sea surface height anomalies
source :
Sea Ice ATBD
units :
meters
Array
Chunk
Bytes
532.00 kiB
532.00 kiB
Shape
(448, 304)
(448, 304)
Dask graph
1 chunks in 2 graph layers
Data type
float32 numpy.ndarray
mean_weighted_earth_free2mean
(grid_y, grid_x)
float32
dask.array<chunksize=(448, 304), meta=np.ndarray>
contentType :
modelResult
description :
Mean of the solid earth permanent tide correction (height_segment_earth_free2mean in ATL10) sampled at each reference surface height location used in the daily grid cell. Subtract from mean_ssha to remove the solid earth permanent tide.
grid_mapping :
crs
long_name :
Daily mean solid earth tide free-to-mean conversion
source :
Sea Ice ATBD
standard_name :
solid earth tide free2mean
units :
meters
Array
Chunk
Bytes
532.00 kiB
532.00 kiB
Shape
(448, 304)
(448, 304)
Dask graph
1 chunks in 2 graph layers
Data type
float32 numpy.ndarray
mean_weighted_geoid
(grid_y, grid_x)
float32
dask.array<chunksize=(448, 304), meta=np.ndarray>
contentType :
modelResult
description :
Mean of the geoid values (height_segment_geoid in ATL10) sampled at each reference surface height location used in the daily grid cell. Geoid is expressed relative to the WGS-84 reference ellipsoid from EGM2008 and is in a mean-tide system.
grid_mapping :
crs
long_name :
Daily mean geoid
source :
Sea Ice ATBD
units :
meters
Array
Chunk
Bytes
532.00 kiB
532.00 kiB
Shape
(448, 304)
(448, 304)
Dask graph
1 chunks in 2 graph layers
Data type
float32 numpy.ndarray
mean_weighted_geoid_free2mean
(grid_y, grid_x)
float32
dask.array<chunksize=(448, 304), meta=np.ndarray>
contentType :
modelResult
description :
Mean of the geoid free-to-mean correction (height_segment_geoid_free2mean in ATL10) sampled at each reference surface height location used in the daily grid cell. Subtract from mean_weighted_mss or mean_weighted_geoid to convert to a tide-free system.
grid_mapping :
crs
long_name :
Daily mean geoid free-to-mean conversion
source :
Sea Ice ATBD
standard_name :
geoid free2mean
units :
meters
Array
Chunk
Bytes
532.00 kiB
532.00 kiB
Shape
(448, 304)
(448, 304)
Dask graph
1 chunks in 2 graph layers
Data type
float32 numpy.ndarray
mean_weighted_mss
(grid_y, grid_x)
float32
dask.array<chunksize=(448, 304), meta=np.ndarray>
contentType :
modelResult
description :
Grid-cell mean of the Mean Sea Surface (MSS) values sampled at each reference surface height location used in the daily grid cell. MSS in ATL10 is expressed relative to the WGS-84 reference ellipsoid from a CryoSat-2/DTU13 merged product (https://doi.org/10. 5281/zenodo.4294047) and is in a tide free system. MSS is converted to mean tide when sampled by ATL21 using the geoid_free2mean correction.
grid_mapping :
crs
long_name :
Daily mean MSS
source :
Sea Ice ATBD
units :
meters
Array
Chunk
Bytes
532.00 kiB
532.00 kiB
Shape
(448, 304)
(448, 304)
Dask graph
1 chunks in 2 graph layers
Data type
float32 numpy.ndarray
n_refsurfs
(grid_y, grid_x)
float64
dask.array<chunksize=(448, 304), meta=np.ndarray>
contentType :
modelResult
description :
Number of reference surface sections used in each daily grid cell.
grid_mapping :
crs
long_name :
Daily population count
source :
Sea Ice ATBD
units :
1
Array
Chunk
Bytes
1.04 MiB
1.04 MiB
Shape
(448, 304)
(448, 304)
Dask graph
1 chunks in 2 graph layers
Data type
float64 numpy.ndarray
sigma
(grid_y, grid_x)
float32
dask.array<chunksize=(448, 304), meta=np.ndarray>
contentType :
modelResult
description :
Standard deviation of daily gridded mean sea surface height anomaly, computed following ATBD section 6.3.
grid_mapping :
crs
long_name :
Daily standard deviation
source :
Sea Ice ATBD
units :
meters
Array
Chunk
Bytes
532.00 kiB
532.00 kiB
Shape
(448, 304)
(448, 304)
Dask graph
1 chunks in 2 graph layers
Data type
float32 numpy.ndarray
description :
Gridded daily averages
...
/daily/day29
grid_y: 448
grid_x: 304
phony_dim_31: 1
delta_time_beg
(phony_dim_31)
datetime64[ns]
dask.array<chunksize=(1,), meta=np.ndarray>
contentType :
modelResult
description :
Center time of the first reference surface used in this gridded composite in seconds since the ATLAS SDP GPS Epoch. The ATLAS Standard Data Products (SDP) epoch offset is defined within /ancillary_data/atlas_sdp_gps_epoch as the number of GPS seconds between the GPS epoch (1980-01-06T00:00:00.000000Z UTC) and the ATLAS SDP epoch. By adding the offset contained within atlas_sdp_gps_epoch to delta time parameters, the time in gps_seconds relative to the GPS epoch can be computed.
long_name :
Elapsed GPS seconds
source :
Derived via Time Tagging
standard_name :
time
Array
Chunk
Bytes
8 B
8 B
Shape
(1,)
(1,)
Dask graph
1 chunks in 2 graph layers
Data type
datetime64[ns] numpy.ndarray
delta_time_end
(phony_dim_31)
datetime64[ns]
dask.array<chunksize=(1,), meta=np.ndarray>
contentType :
modelResult
description :
Center time of the last reference surface used in this gridded composite in seconds since the ATLAS SDP GPS Epoch. The ATLAS Standard Data Products (SDP) epoch offset is defined within /ancillary_data/atlas_sdp_gps_epoch as the number of GPS seconds between the GPS epoch (1980-01-06T00:00:00.000000Z UTC) and the ATLAS SDP epoch. By adding the offset contained within atlas_sdp_gps_epoch to delta time parameters, the time in gps_seconds relative to the GPS epoch can be computed.
long_name :
Elapsed GPS seconds
source :
Derived via Time Tagging
standard_name :
time
Array
Chunk
Bytes
8 B
8 B
Shape
(1,)
(1,)
Dask graph
1 chunks in 2 graph layers
Data type
datetime64[ns] numpy.ndarray
mean_ssha
(grid_y, grid_x)
float32
dask.array<chunksize=(448, 304), meta=np.ndarray>
contentType :
modelResult
description :
Daily mean sea surface height anomalies (SSHA) for each daily grid cell. Sea surface height anomalies expressed relative to the mean sea surface (other geophysical corrections also applied, as indicated in the ATBD) using the reference surface heights.
grid_mapping :
crs
long_name :
Daily mean sea surface height anomalies
source :
Sea Ice ATBD
units :
meters
Array
Chunk
Bytes
532.00 kiB
532.00 kiB
Shape
(448, 304)
(448, 304)
Dask graph
1 chunks in 2 graph layers
Data type
float32 numpy.ndarray
mean_weighted_earth_free2mean
(grid_y, grid_x)
float32
dask.array<chunksize=(448, 304), meta=np.ndarray>
contentType :
modelResult
description :
Mean of the solid earth permanent tide correction (height_segment_earth_free2mean in ATL10) sampled at each reference surface height location used in the daily grid cell. Subtract from mean_ssha to remove the solid earth permanent tide.
grid_mapping :
crs
long_name :
Daily mean solid earth tide free-to-mean conversion
source :
Sea Ice ATBD
standard_name :
solid earth tide free2mean
units :
meters
Array
Chunk
Bytes
532.00 kiB
532.00 kiB
Shape
(448, 304)
(448, 304)
Dask graph
1 chunks in 2 graph layers
Data type
float32 numpy.ndarray
mean_weighted_geoid
(grid_y, grid_x)
float32
dask.array<chunksize=(448, 304), meta=np.ndarray>
contentType :
modelResult
description :
Mean of the geoid values (height_segment_geoid in ATL10) sampled at each reference surface height location used in the daily grid cell. Geoid is expressed relative to the WGS-84 reference ellipsoid from EGM2008 and is in a mean-tide system.
grid_mapping :
crs
long_name :
Daily mean geoid
source :
Sea Ice ATBD
units :
meters
Array
Chunk
Bytes
532.00 kiB
532.00 kiB
Shape
(448, 304)
(448, 304)
Dask graph
1 chunks in 2 graph layers
Data type
float32 numpy.ndarray
mean_weighted_geoid_free2mean
(grid_y, grid_x)
float32
dask.array<chunksize=(448, 304), meta=np.ndarray>
contentType :
modelResult
description :
Mean of the geoid free-to-mean correction (height_segment_geoid_free2mean in ATL10) sampled at each reference surface height location used in the daily grid cell. Subtract from mean_weighted_mss or mean_weighted_geoid to convert to a tide-free system.
grid_mapping :
crs
long_name :
Daily mean geoid free-to-mean conversion
source :
Sea Ice ATBD
standard_name :
geoid free2mean
units :
meters
Array
Chunk
Bytes
532.00 kiB
532.00 kiB
Shape
(448, 304)
(448, 304)
Dask graph
1 chunks in 2 graph layers
Data type
float32 numpy.ndarray
mean_weighted_mss
(grid_y, grid_x)
float32
dask.array<chunksize=(448, 304), meta=np.ndarray>
contentType :
modelResult
description :
Grid-cell mean of the Mean Sea Surface (MSS) values sampled at each reference surface height location used in the daily grid cell. MSS in ATL10 is expressed relative to the WGS-84 reference ellipsoid from a CryoSat-2/DTU13 merged product (https://doi.org/10. 5281/zenodo.4294047) and is in a tide free system. MSS is converted to mean tide when sampled by ATL21 using the geoid_free2mean correction.
grid_mapping :
crs
long_name :
Daily mean MSS
source :
Sea Ice ATBD
units :
meters
Array
Chunk
Bytes
532.00 kiB
532.00 kiB
Shape
(448, 304)
(448, 304)
Dask graph
1 chunks in 2 graph layers
Data type
float32 numpy.ndarray
n_refsurfs
(grid_y, grid_x)
float64
dask.array<chunksize=(448, 304), meta=np.ndarray>
contentType :
modelResult
description :
Number of reference surface sections used in each daily grid cell.
grid_mapping :
crs
long_name :
Daily population count
source :
Sea Ice ATBD
units :
1
Array
Chunk
Bytes
1.04 MiB
1.04 MiB
Shape
(448, 304)
(448, 304)
Dask graph
1 chunks in 2 graph layers
Data type
float64 numpy.ndarray
sigma
(grid_y, grid_x)
float32
dask.array<chunksize=(448, 304), meta=np.ndarray>
contentType :
modelResult
description :
Standard deviation of daily gridded mean sea surface height anomaly, computed following ATBD section 6.3.
grid_mapping :
crs
long_name :
Daily standard deviation
source :
Sea Ice ATBD
units :
meters
Array
Chunk
Bytes
532.00 kiB
532.00 kiB
Shape
(448, 304)
(448, 304)
Dask graph
1 chunks in 2 graph layers
Data type
float32 numpy.ndarray
description :
Gridded daily averages
/daily/day30
grid_y: 448
grid_x: 304
phony_dim_32: 1
delta_time_beg
(phony_dim_32)
datetime64[ns]
dask.array<chunksize=(1,), meta=np.ndarray>
contentType :
modelResult
description :
Center time of the first reference surface used in this gridded composite in seconds since the ATLAS SDP GPS Epoch. The ATLAS Standard Data Products (SDP) epoch offset is defined within /ancillary_data/atlas_sdp_gps_epoch as the number of GPS seconds between the GPS epoch (1980-01-06T00:00:00.000000Z UTC) and the ATLAS SDP epoch. By adding the offset contained within atlas_sdp_gps_epoch to delta time parameters, the time in gps_seconds relative to the GPS epoch can be computed.
long_name :
Elapsed GPS seconds
source :
Derived via Time Tagging
standard_name :
time
Array
Chunk
Bytes
8 B
8 B
Shape
(1,)
(1,)
Dask graph
1 chunks in 2 graph layers
Data type
datetime64[ns] numpy.ndarray
delta_time_end
(phony_dim_32)
datetime64[ns]
dask.array<chunksize=(1,), meta=np.ndarray>
contentType :
modelResult
description :
Center time of the last reference surface used in this gridded composite in seconds since the ATLAS SDP GPS Epoch. The ATLAS Standard Data Products (SDP) epoch offset is defined within /ancillary_data/atlas_sdp_gps_epoch as the number of GPS seconds between the GPS epoch (1980-01-06T00:00:00.000000Z UTC) and the ATLAS SDP epoch. By adding the offset contained within atlas_sdp_gps_epoch to delta time parameters, the time in gps_seconds relative to the GPS epoch can be computed.
long_name :
Elapsed GPS seconds
source :
Derived via Time Tagging
standard_name :
time
Array
Chunk
Bytes
8 B
8 B
Shape
(1,)
(1,)
Dask graph
1 chunks in 2 graph layers
Data type
datetime64[ns] numpy.ndarray
mean_ssha
(grid_y, grid_x)
float32
dask.array<chunksize=(448, 304), meta=np.ndarray>
contentType :
modelResult
description :
Daily mean sea surface height anomalies (SSHA) for each daily grid cell. Sea surface height anomalies expressed relative to the mean sea surface (other geophysical corrections also applied, as indicated in the ATBD) using the reference surface heights.
grid_mapping :
crs
long_name :
Daily mean sea surface height anomalies
source :
Sea Ice ATBD
units :
meters
Array
Chunk
Bytes
532.00 kiB
532.00 kiB
Shape
(448, 304)
(448, 304)
Dask graph
1 chunks in 2 graph layers
Data type
float32 numpy.ndarray
mean_weighted_earth_free2mean
(grid_y, grid_x)
float32
dask.array<chunksize=(448, 304), meta=np.ndarray>
contentType :
modelResult
description :
Mean of the solid earth permanent tide correction (height_segment_earth_free2mean in ATL10) sampled at each reference surface height location used in the daily grid cell. Subtract from mean_ssha to remove the solid earth permanent tide.
grid_mapping :
crs
long_name :
Daily mean solid earth tide free-to-mean conversion
source :
Sea Ice ATBD
standard_name :
solid earth tide free2mean
units :
meters
Array
Chunk
Bytes
532.00 kiB
532.00 kiB
Shape
(448, 304)
(448, 304)
Dask graph
1 chunks in 2 graph layers
Data type
float32 numpy.ndarray
mean_weighted_geoid
(grid_y, grid_x)
float32
dask.array<chunksize=(448, 304), meta=np.ndarray>
contentType :
modelResult
description :
Mean of the geoid values (height_segment_geoid in ATL10) sampled at each reference surface height location used in the daily grid cell. Geoid is expressed relative to the WGS-84 reference ellipsoid from EGM2008 and is in a mean-tide system.
grid_mapping :
crs
long_name :
Daily mean geoid
source :
Sea Ice ATBD
units :
meters
Array
Chunk
Bytes
532.00 kiB
532.00 kiB
Shape
(448, 304)
(448, 304)
Dask graph
1 chunks in 2 graph layers
Data type
float32 numpy.ndarray
mean_weighted_geoid_free2mean
(grid_y, grid_x)
float32
dask.array<chunksize=(448, 304), meta=np.ndarray>
contentType :
modelResult
description :
Mean of the geoid free-to-mean correction (height_segment_geoid_free2mean in ATL10) sampled at each reference surface height location used in the daily grid cell. Subtract from mean_weighted_mss or mean_weighted_geoid to convert to a tide-free system.
grid_mapping :
crs
long_name :
Daily mean geoid free-to-mean conversion
source :
Sea Ice ATBD
standard_name :
geoid free2mean
units :
meters
Array
Chunk
Bytes
532.00 kiB
532.00 kiB
Shape
(448, 304)
(448, 304)
Dask graph
1 chunks in 2 graph layers
Data type
float32 numpy.ndarray
mean_weighted_mss
(grid_y, grid_x)
float32
dask.array<chunksize=(448, 304), meta=np.ndarray>
contentType :
modelResult
description :
Grid-cell mean of the Mean Sea Surface (MSS) values sampled at each reference surface height location used in the daily grid cell. MSS in ATL10 is expressed relative to the WGS-84 reference ellipsoid from a CryoSat-2/DTU13 merged product (https://doi.org/10. 5281/zenodo.4294047) and is in a tide free system. MSS is converted to mean tide when sampled by ATL21 using the geoid_free2mean correction.
grid_mapping :
crs
long_name :
Daily mean MSS
source :
Sea Ice ATBD
units :
meters
Array
Chunk
Bytes
532.00 kiB
532.00 kiB
Shape
(448, 304)
(448, 304)
Dask graph
1 chunks in 2 graph layers
Data type
float32 numpy.ndarray
n_refsurfs
(grid_y, grid_x)
float64
dask.array<chunksize=(448, 304), meta=np.ndarray>
contentType :
modelResult
description :
Number of reference surface sections used in each daily grid cell.
grid_mapping :
crs
long_name :
Daily population count
source :
Sea Ice ATBD
units :
1
Array
Chunk
Bytes
1.04 MiB
1.04 MiB
Shape
(448, 304)
(448, 304)
Dask graph
1 chunks in 2 graph layers
Data type
float64 numpy.ndarray
sigma
(grid_y, grid_x)
float32
dask.array<chunksize=(448, 304), meta=np.ndarray>
contentType :
modelResult
description :
Standard deviation of daily gridded mean sea surface height anomaly, computed following ATBD section 6.3.
grid_mapping :
crs
long_name :
Daily standard deviation
source :
Sea Ice ATBD
units :
meters
Array
Chunk
Bytes
532.00 kiB
532.00 kiB
Shape
(448, 304)
(448, 304)
Dask graph
1 chunks in 2 graph layers
Data type
float32 numpy.ndarray
description :
Gridded daily averages
/daily/day31
grid_y: 448
grid_x: 304
phony_dim_33: 1
delta_time_beg
(phony_dim_33)
datetime64[ns]
dask.array<chunksize=(1,), meta=np.ndarray>
contentType :
modelResult
description :
Center time of the first reference surface used in this gridded composite in seconds since the ATLAS SDP GPS Epoch. The ATLAS Standard Data Products (SDP) epoch offset is defined within /ancillary_data/atlas_sdp_gps_epoch as the number of GPS seconds between the GPS epoch (1980-01-06T00:00:00.000000Z UTC) and the ATLAS SDP epoch. By adding the offset contained within atlas_sdp_gps_epoch to delta time parameters, the time in gps_seconds relative to the GPS epoch can be computed.
long_name :
Elapsed GPS seconds
source :
Derived via Time Tagging
standard_name :
time
Array
Chunk
Bytes
8 B
8 B
Shape
(1,)
(1,)
Dask graph
1 chunks in 2 graph layers
Data type
datetime64[ns] numpy.ndarray
delta_time_end
(phony_dim_33)
datetime64[ns]
dask.array<chunksize=(1,), meta=np.ndarray>
contentType :
modelResult
description :
Center time of the last reference surface used in this gridded composite in seconds since the ATLAS SDP GPS Epoch. The ATLAS Standard Data Products (SDP) epoch offset is defined within /ancillary_data/atlas_sdp_gps_epoch as the number of GPS seconds between the GPS epoch (1980-01-06T00:00:00.000000Z UTC) and the ATLAS SDP epoch. By adding the offset contained within atlas_sdp_gps_epoch to delta time parameters, the time in gps_seconds relative to the GPS epoch can be computed.
long_name :
Elapsed GPS seconds
source :
Derived via Time Tagging
standard_name :
time
Array
Chunk
Bytes
8 B
8 B
Shape
(1,)
(1,)
Dask graph
1 chunks in 2 graph layers
Data type
datetime64[ns] numpy.ndarray
mean_ssha
(grid_y, grid_x)
float32
dask.array<chunksize=(448, 304), meta=np.ndarray>
contentType :
modelResult
description :
Daily mean sea surface height anomalies (SSHA) for each daily grid cell. Sea surface height anomalies expressed relative to the mean sea surface (other geophysical corrections also applied, as indicated in the ATBD) using the reference surface heights.
grid_mapping :
crs
long_name :
Daily mean sea surface height anomalies
source :
Sea Ice ATBD
units :
meters
Array
Chunk
Bytes
532.00 kiB
532.00 kiB
Shape
(448, 304)
(448, 304)
Dask graph
1 chunks in 2 graph layers
Data type
float32 numpy.ndarray
mean_weighted_earth_free2mean
(grid_y, grid_x)
float32
dask.array<chunksize=(448, 304), meta=np.ndarray>
contentType :
modelResult
description :
Mean of the solid earth permanent tide correction (height_segment_earth_free2mean in ATL10) sampled at each reference surface height location used in the daily grid cell. Subtract from mean_ssha to remove the solid earth permanent tide.
grid_mapping :
crs
long_name :
Daily mean solid earth tide free-to-mean conversion
source :
Sea Ice ATBD
standard_name :
solid earth tide free2mean
units :
meters
Array
Chunk
Bytes
532.00 kiB
532.00 kiB
Shape
(448, 304)
(448, 304)
Dask graph
1 chunks in 2 graph layers
Data type
float32 numpy.ndarray
mean_weighted_geoid
(grid_y, grid_x)
float32
dask.array<chunksize=(448, 304), meta=np.ndarray>
contentType :
modelResult
description :
Mean of the geoid values (height_segment_geoid in ATL10) sampled at each reference surface height location used in the daily grid cell. Geoid is expressed relative to the WGS-84 reference ellipsoid from EGM2008 and is in a mean-tide system.
grid_mapping :
crs
long_name :
Daily mean geoid
source :
Sea Ice ATBD
units :
meters
Array
Chunk
Bytes
532.00 kiB
532.00 kiB
Shape
(448, 304)
(448, 304)
Dask graph
1 chunks in 2 graph layers
Data type
float32 numpy.ndarray
mean_weighted_geoid_free2mean
(grid_y, grid_x)
float32
dask.array<chunksize=(448, 304), meta=np.ndarray>
contentType :
modelResult
description :
Mean of the geoid free-to-mean correction (height_segment_geoid_free2mean in ATL10) sampled at each reference surface height location used in the daily grid cell. Subtract from mean_weighted_mss or mean_weighted_geoid to convert to a tide-free system.
grid_mapping :
crs
long_name :
Daily mean geoid free-to-mean conversion
source :
Sea Ice ATBD
standard_name :
geoid free2mean
units :
meters
Array
Chunk
Bytes
532.00 kiB
532.00 kiB
Shape
(448, 304)
(448, 304)
Dask graph
1 chunks in 2 graph layers
Data type
float32 numpy.ndarray
mean_weighted_mss
(grid_y, grid_x)
float32
dask.array<chunksize=(448, 304), meta=np.ndarray>
contentType :
modelResult
description :
Grid-cell mean of the Mean Sea Surface (MSS) values sampled at each reference surface height location used in the daily grid cell. MSS in ATL10 is expressed relative to the WGS-84 reference ellipsoid from a CryoSat-2/DTU13 merged product (https://doi.org/10. 5281/zenodo.4294047) and is in a tide free system. MSS is converted to mean tide when sampled by ATL21 using the geoid_free2mean correction.
grid_mapping :
crs
long_name :
Daily mean MSS
source :
Sea Ice ATBD
units :
meters
Array
Chunk
Bytes
532.00 kiB
532.00 kiB
Shape
(448, 304)
(448, 304)
Dask graph
1 chunks in 2 graph layers
Data type
float32 numpy.ndarray
n_refsurfs
(grid_y, grid_x)
float64
dask.array<chunksize=(448, 304), meta=np.ndarray>
contentType :
modelResult
description :
Number of reference surface sections used in each daily grid cell.
grid_mapping :
crs
long_name :
Daily population count
source :
Sea Ice ATBD
units :
1
Array
Chunk
Bytes
1.04 MiB
1.04 MiB
Shape
(448, 304)
(448, 304)
Dask graph
1 chunks in 2 graph layers
Data type
float64 numpy.ndarray
sigma
(grid_y, grid_x)
float32
dask.array<chunksize=(448, 304), meta=np.ndarray>
contentType :
modelResult
description :
Standard deviation of daily gridded mean sea surface height anomaly, computed following ATBD section 6.3.
grid_mapping :
crs
long_name :
Daily standard deviation
source :
Sea Ice ATBD
units :
meters
Array
Chunk
Bytes
532.00 kiB
532.00 kiB
Shape
(448, 304)
(448, 304)
Dask graph
1 chunks in 2 graph layers
Data type
float32 numpy.ndarray
description :
Gridded daily averages
description :
gridded daily averages
/monthly
grid_y: 448
grid_x: 304
phony_dim_34: 1
delta_time_beg
(phony_dim_34)
datetime64[ns]
dask.array<chunksize=(1,), meta=np.ndarray>
contentType :
modelResult
description :
Center time of the first reference surface used in this gridded composite in seconds since the ATLAS SDP GPS Epoch. The ATLAS Standard Data Products (SDP) epoch offset is defined within /ancillary_data/atlas_sdp_gps_epoch as the number of GPS seconds between the GPS epoch (1980-01-06T00:00:00.000000Z UTC) and the ATLAS SDP epoch. By adding the offset contained within atlas_sdp_gps_epoch to delta time parameters, the time in gps_seconds relative to the GPS epoch can be computed.
long_name :
Elapsed GPS seconds
source :
Derived via Time Tagging
standard_name :
time
Array
Chunk
Bytes
8 B
8 B
Shape
(1,)
(1,)
Dask graph
1 chunks in 2 graph layers
Data type
datetime64[ns] numpy.ndarray
delta_time_end
(phony_dim_34)
datetime64[ns]
dask.array<chunksize=(1,), meta=np.ndarray>
contentType :
modelResult
description :
Center time of the last reference surface used in this gridded composite in seconds since the ATLAS SDP GPS Epoch. The ATLAS Standard Data Products (SDP) epoch offset is defined within /ancillary_data/atlas_sdp_gps_epoch as the number of GPS seconds between the GPS epoch (1980-01-06T00:00:00.000000Z UTC) and the ATLAS SDP epoch. By adding the offset contained within atlas_sdp_gps_epoch to delta time parameters, the time in gps_seconds relative to the GPS epoch can be computed.
long_name :
Elapsed GPS seconds
source :
Derived via Time Tagging
standard_name :
time
Array
Chunk
Bytes
8 B
8 B
Shape
(1,)
(1,)
Dask graph
1 chunks in 2 graph layers
Data type
datetime64[ns] numpy.ndarray
mean_ssha
(grid_y, grid_x)
float32
dask.array<chunksize=(448, 304), meta=np.ndarray>
contentType :
modelResult
description :
Monthly mean sea surface height anomalies (SSHA) for each monthly grid cell. Sea surface height anomalies expressed relative to the mean sea surface (other geophysical corrections also applied, as indicated in the ATBD) calculated as the mean of all available daily mean_ssha values.
grid_mapping :
crs
long_name :
Monthly mean sea surface height anomalies
source :
Sea Ice ATBD
units :
meters
Array
Chunk
Bytes
532.00 kiB
532.00 kiB
Shape
(448, 304)
(448, 304)
Dask graph
1 chunks in 2 graph layers
Data type
float32 numpy.ndarray
mean_weighted_earth_free2mean
(grid_y, grid_x)
float32
dask.array<chunksize=(448, 304), meta=np.ndarray>
contentType :
modelResult
description :
Mean monthly solid earth permanent tide correction calculated from all available daily mean_weighted_earth_free2mean values. Subtract from mean_ssha to remove the solid earth permanent tide.
grid_mapping :
crs
long_name :
Monthly mean solid earth tide free-to-mean conversion
source :
Sea Ice ATBD
standard_name :
solid earth tide free2mean
units :
meters
Array
Chunk
Bytes
532.00 kiB
532.00 kiB
Shape
(448, 304)
(448, 304)
Dask graph
1 chunks in 2 graph layers
Data type
float32 numpy.ndarray
mean_weighted_geoid
(grid_y, grid_x)
float32
dask.array<chunksize=(448, 304), meta=np.ndarray>
contentType :
modelResult
description :
Mean monthly geoid calculated from all available daily mean_weighted_geoid values. Geoid is expressed relative to the WGS-84 reference ellipsoid from EGM2008 and is in a mean-tide system.
grid_mapping :
crs
long_name :
Monthly mean geoid
source :
Sea Ice ATBD
units :
meters
Array
Chunk
Bytes
532.00 kiB
532.00 kiB
Shape
(448, 304)
(448, 304)
Dask graph
1 chunks in 2 graph layers
Data type
float32 numpy.ndarray
mean_weighted_geoid_free2mean
(grid_y, grid_x)
float32
dask.array<chunksize=(448, 304), meta=np.ndarray>
contentType :
modelResult
description :
Mean monthly geoid free-to-mean correction calculated from all available daily mean_weighted_geoid values. Subtract from mean_weighted_mss or mean_weighted_geoid to covert to a tide-free system.
grid_mapping :
crs
long_name :
Monthly mean geoid free-to-mean conversion
source :
Sea Ice ATBD
standard_name :
geoid free2mean
units :
meters
Array
Chunk
Bytes
532.00 kiB
532.00 kiB
Shape
(448, 304)
(448, 304)
Dask graph
1 chunks in 2 graph layers
Data type
float32 numpy.ndarray
mean_weighted_mss
(grid_y, grid_x)
float32
dask.array<chunksize=(448, 304), meta=np.ndarray>
contentType :
modelResult
description :
Mean monthly MSS calculated from all available daily mean_weighted_mss values. MSS is expressed relative to the WGS-84 reference ellipsoid from a DTU/CS-2 merged product (https://doi.org/10.5281/zenodo.4294047) and is in a mean-tide system.
grid_mapping :
crs
long_name :
Monthly mean MSS
source :
Sea Ice ATBD
units :
meters
Array
Chunk
Bytes
532.00 kiB
532.00 kiB
Shape
(448, 304)
(448, 304)
Dask graph
1 chunks in 2 graph layers
Data type
float32 numpy.ndarray
n_refsurfs
(grid_y, grid_x)
float64
dask.array<chunksize=(448, 304), meta=np.ndarray>
contentType :
modelResult
description :
Number of reference surface sections used in each monthly grid cell
grid_mapping :
crs
long_name :
Monthly population count
source :
Sea Ice ATBD
units :
1
Array
Chunk
Bytes
1.04 MiB
1.04 MiB
Shape
(448, 304)
(448, 304)
Dask graph
1 chunks in 2 graph layers
Data type
float64 numpy.ndarray
sigma
(grid_y, grid_x)
float32
dask.array<chunksize=(448, 304), meta=np.ndarray>
contentType :
modelResult
description :
Standard deviation of monthly gridded mean sea surface height anomaly, computed following ATBD section 6.3.
grid_mapping :
crs
long_name :
Monthly standard deviation
source :
Sea Ice ATBD
units :
meters
Array
Chunk
Bytes
532.00 kiB
532.00 kiB
Shape
(448, 304)
(448, 304)
Dask graph
1 chunks in 2 graph layers
Data type
float32 numpy.ndarray
description :
Gridded Monthly averages
/orbit_info
grid_y: 448
grid_x: 304
crossing_time: 440
sc_orient_time: 2
crossing_time
(crossing_time)
datetime64[ns]
2018-12-01T01:32:23.791901192 .....
contentType :
referenceInformation
description :
The time, in seconds since the ATLAS SDP GPS Epoch, at which the ascending node crosses the equator. The ATLAS Standard Data Products (SDP) epoch offset is defined within /ancillary_data/atlas_sdp_gps_epoch as the number of GPS seconds between the GPS epoch (1980-01-06T00:00:00.000000Z UTC) and the ATLAS SDP epoch. By adding the offset contained within atlas_sdp_gps_epoch to delta time parameters, the time in gps_seconds relative to the GPS epoch can be computed.
The time of the last spacecraft orientation change between forward, backward and transitional flight modes, expressed in seconds since the ATLAS SDP GPS Epoch. ICESat-2 is considered to be flying forward when the weak beams are leading the strong beams; and backward when the strong beams are leading the weak beams. ICESat-2 is considered to be in transition while it is maneuvering between the two orientations. Science quality is potentially degraded while in transition mode. The ATLAS Standard Data Products (SDP) epoch offset is defined within /ancillary_data/atlas_sdp_gps_epoch as the number of GPS seconds between the GPS epoch (1980-01-06T00:00:00.000000Z UTC) and the ATLAS SDP epoch. By adding the offset contained within atlas_sdp_gps_epoch to delta time parameters, the time in gps_seconds relative to the GPS epoch can be computed.
A count of the number of exact repeats of this reference orbit.
long_name :
Cycle Number
source :
Operations
units :
1
valid_max :
50
valid_min :
0
Array
Chunk
Bytes
440 B
10 B
Shape
(440,)
(10,)
Dask graph
44 chunks in 2 graph layers
Data type
int8 numpy.ndarray
lan
(crossing_time)
float64
dask.array<chunksize=(16,), meta=np.ndarray>
contentType :
referenceInformation
description :
Longitude at the ascending node crossing.
long_name :
Ascending Node Longitude
source :
POD/PPD
units :
degrees_east
valid_max :
180.0
valid_min :
-180.0
Array
Chunk
Bytes
3.44 kiB
128 B
Shape
(440,)
(16,)
Dask graph
28 chunks in 2 graph layers
Data type
float64 numpy.ndarray
orbit_number
(crossing_time)
uint16
dask.array<chunksize=(16,), meta=np.ndarray>
contentType :
referenceInformation
description :
Unique identifying number for each planned ICESat-2 orbit.
long_name :
Orbit Number
source :
Operations
units :
1
valid_max :
65000
valid_min :
1
Array
Chunk
Bytes
880 B
32 B
Shape
(440,)
(16,)
Dask graph
28 chunks in 2 graph layers
Data type
uint16 numpy.ndarray
rgt
(crossing_time)
int16
dask.array<chunksize=(10,), meta=np.ndarray>
contentType :
referenceInformation
description :
The reference ground track (RGT) is the track on the earth at which a specified unit vector within the observatory is pointed. Under nominal operating conditions, there will be no data collected along the RGT, as the RGT is spanned by GT3 and GT4. During slews or off-pointing, it is possible that ground tracks may intersect the RGT. The ICESat-2 mission has 1387 RGTs.
long_name :
Reference Ground track
source :
POD/PPD
units :
1
valid_max :
1387
valid_min :
1
Array
Chunk
Bytes
880 B
20 B
Shape
(440,)
(10,)
Dask graph
44 chunks in 2 graph layers
Data type
int16 numpy.ndarray
sc_orient
(sc_orient_time)
int8
dask.array<chunksize=(2,), meta=np.ndarray>
contentType :
referenceInformation
description :
This parameter tracks the spacecraft orientation between forward, backward and transitional flight modes. ICESat-2 is considered to be flying forward when the weak beams are leading the strong beams; and backward when the strong beams are leading the weak beams. ICESat-2 is considered to be in transition while it is maneuvering between the two orientations. Science quality is potentially degraded while in transition mode.
flag_meanings :
backward forward transition
flag_values :
[0 1 2]
long_name :
Spacecraft Orientation
source :
POD/PPD
units :
1
valid_max :
2
valid_min :
0
Array
Chunk
Bytes
2 B
2 B
Shape
(2,)
(2,)
Dask graph
1 chunks in 2 graph layers
Data type
int8 numpy.ndarray
description :
Contains orbit information.
data_rate :
Varies. Data are only provided when one of the stored values (besides time) changes.
/quality_assessment
grid_y: 448
grid_x: 304
phony_dim_35: 1
qa_granule_fail_reason
(phony_dim_35)
int32
dask.array<chunksize=(1,), meta=np.ndarray>
contentType :
qualityInformation
description :
Flag indicating granule failure reason. 0=no failure; 1=processing error; 2=Insufficient output data was generated; 3=TBD Failure; 4=TBD_Failure; 5=other failure.
Contains quality assessment data. This may include QA counters, QA along-track data and/or QA summary data.
/METADATA
(6/9)
/METADATA/AcquisitionInformation
/METADATA/AcquisitionInformation/lidar
Description :
Describe the group
pulse_rate :
10000 pps
wavelength :
532 nm
identifier :
ATLAS
type :
Laser Altimeter
description :
ATLAS on ICESat-2 determines the range between the satellite and the Earth's surface by measuring the two-way time delay of short pulses of laser light that it transmits in six beams. It is different from previous operational ice-sheet altimeters in that it is a photon-counting LIDAR. ATLAS records a set of arrival times for individual photons, which are then analyzed to derive surface, vegetation, and cloud properties. ATLAS has six beams arranged in three pairs, so that it samples each of three reference pair tracks with a pair of beams; ATLAS transmits pulses at 10 kHz, giving approximately one pulse every 0.7 m along track; ATLAS's expected pointing control will be better than 90 m RMS.
/METADATA/AcquisitionInformation/lidarDocument
Description :
Describe the group
edition :
Pre-Release
publicationDate :
12/31/17
title :
A document describing the ATLAS instrument will be provided by the ICESat-2 Project Science Office.
/METADATA/AcquisitionInformation/platform
Description :
Describe the group
identifier :
ICESat-2
description :
Ice, Cloud, and land Elevation Satellite-2
type :
Spacecraft
/METADATA/AcquisitionInformation/platformDocument
Description :
Describe the group
edition :
31-Dec-16
publicationDate :
31-Dec-16
title :
The Ice, Cloud, and land Elevation Satellite-2 (ICESat-2): Science requirements, concept, and implementation. Thorsten Markus, Tom Neumann, Anthony Martino, Waleed Abdalati, Kelly Brunt, Beata Csatho, Sinead Farrell, Helen Fricker, Alex Gardner, David Harding, Michael Jasinski, Ron Kwok, Lori Magruder, Dan Lubin, Scott Luthcke, James Morison, Ross Nelson, Amy Neuenschwander, Stephen Palm, Sorin Popescu, CK Shum, Bob E. Schutz, Benjamin Smith, Yuekui Yang, Jay Zwally. http://dx.doi.org/10.1016/j.rse.2016.12.029
Description :
Describe the group
/METADATA/DataQuality
/METADATA/DataQuality/CompletenessOmission
Description :
Describe the group
evaluationMethodType :
directInternal
measureDescription :
TBD
nameOfMeasure :
TBD
unitofMeasure :
TBD
value :
NOT_SET
/METADATA/DataQuality/DomainConsistency
Description :
Describe the group
evaluationMethodType :
directInternal
measureDescription :
TBD
nameOfMeasure :
TBD
unitofMeasure :
TBD
value :
NOT_SET
Description :
Describe the group
scope :
NOT_SET
/METADATA/DatasetIdentification
Description :
Describe the group
spatialRepresentationType :
along-track
creationDate :
2025-10-29T18:16:05.000000Z
uuid :
f382a7eb-a47f-31f0-9f2e-73f50aca7262
fileName :
ATL21-01_20181201013224_09690101_004_01.h5
VersionID :
004
language :
eng
characterSet :
utf8
shortName :
ATL21
originatorOrganizationName :
GSFC I-SIPS > ICESat-2 Science Investigator-led Processing System
abstract :
TBD
purpose :
Scientific Research
credit :
The software that generates the ATL21 product was designed and implemented within the ICESat-2 Science Investigator-led Processing System at the NASA Goddard Space Flight Center in Greenbelt, Maryland.
status :
onGoing
topicCategory :
geoscientificInformation
...
/METADATA/ProductSpecificationDocument
Description :
Describe the group
ShortName :
ATL21_SDP
characterSet :
utf8
edition :
v4.3
language :
eng
publicationDate :
Feb 2020
title :
ICESat-2-SIPS-SPEC-4207 - ATLAS Science Algorithm Standard Data Product (SDP) Volume 12 (ATL10). Revision -.
/METADATA/QADatasetIdentification
Description :
Describe the group
abstract :
An ASCII product that contains statistical information on data product results. These statistics enable data producers and users to assess the quality of the data in the data product granule
creationDate :
2025-10-29T18:18:23.000000Z
fileName :
ATL21-01_20181201013224_09690101_004_01.qa
/METADATA/SeriesIdentification
Description :
Describe the group
maintenanceAndUpdateFrequency :
asNeeded
maintenanceDate :
SET_BY_META
VersionID :
004
language :
eng
characterSet :
utf8
pointOfContact :
NSIDC DAAC > NASA National Snow and Ice Data Center Distributed Active Archive Center
National Aeronautics and Space Administration (NASA)
abstract :
TBD
purpose :
Scientific Research
credit :
The software that generates the ATL21 product was designed and implemented within the ICESat-2 Science Investigator-led Processing System at the NASA Goddard Space Flight Center in Greenbelt, Maryland.
status :
onGoing
format :
HDF
formatVersion :
5
topicCategory :
geoscientificInformation
mission :
ICESat-2 > Ice, Cloud, and land Elevation Satellite-2
grid_y: 448
grid_x: 304
phony_dim_36: 1
iso_19139_dataset_xml
(phony_dim_36)
|S9708
dask.array<chunksize=(1,), meta=np.ndarray>
description :
ISO 19139 Dataset XML
long_name :
ISO 19139 Dataset XML
Array
Chunk
Bytes
9.48 kiB
9.48 kiB
Shape
(1,)
(1,)
Dask graph
1 chunks in 2 graph layers
Data type
|S9708 numpy.ndarray
iso_19139_series_xml
(phony_dim_36)
|S37791
dask.array<chunksize=(1,), meta=np.ndarray>
description :
ISO 19139 Series XML
long_name :
ISO 19139 Series XML
Array
Chunk
Bytes
36.91 kiB
36.91 kiB
Shape
(1,)
(1,)
Dask graph
1 chunks in 2 graph layers
Data type
|S37791 numpy.ndarray
Description :
ISO19115 Structured Metadata Represented within HDF5
PROJCS["NSIDC Sea Ice Polar Stereographic North",GEOGCS["Unspecified datum based upon the Hughes 1980 ellipsoid",DATUM["Not_specified_based_on_Hughes_1980_ellipsoid",SPHEROID["Hughes 1980",6378273,298.279411123061,AUTHORITY["EPSG","7058"]],AUTHORITY["EPSG","6054"]],PRIMEM["Greenwich",0,AUTHORITY["EPSG","8901"]],UNIT["degree",0.0174532925199433,AUTHORITY["EPSG","9122"]],AUTHORITY["EPSG","4054"]],PROJECTION["Polar_Stereographic"],PARAMETER["latitude_of_origin",70],PARAMETER["central_meridian",-45],PARAMETER["scale_factor",1],PARAMETER["false_easting",0],PARAMETER["false_northing",0],UNIT["metre",1,AUTHORITY["EPSG","9001"]],AXIS["X",EAST],AXIS["Y",NORTH],AUTHORITY["EPSG","3411"]]
description :
Coordinate reference system identification for NSIDC Sea Ice Polar Stereographic (Hughes ellipsoid).
Gridded map which describes each grid cell as land (=1) or ocean/sea ice (=0)
grid_mapping :
crs
long_name :
land mask map
source :
Sea Ice ATBD
units :
1
valid_max :
1
valid_min :
0
Array
Chunk
Bytes
1.04 MiB
1.04 MiB
Shape
(448, 304)
(448, 304)
Dask graph
1 chunks in 2 graph layers
Data type
float64 numpy.ndarray
short_name :
ATL21
level :
L3B
description :
This data set (ATL21) contains daily and monthly gridded polar sea surface height anomalies
Conventions :
CF-1.7
contributor_name :
Alek Petty (alek.a.petty@nasa.gov), Ron Kwok (rkwok01@uw.edu), Marco Bagnardi (marco.bagnardi@nasa.gov), Nathan Kurtz (nathan.t.kurtz@nasa.gov), Jeff Lee (jeffrey.e.lee@nasa.gov), Jesse Wimert (jesse.wimert@us.kbr.com), David Hancock (david.w.hancock@nasa.gov)
Data may not be reproduced or distributed without including the citation for this product included in this metadata. Data may not be distributed in an altered form without the written permission of the ICESat-2 Science Project Office at NASA/GSFC.
naming_authority :
http://dx.doi.org
spatial_coverage_type :
Horizontal
standard_name_vocabulary :
CF-1.6
time_type :
CCSDS UTC-A
date_created :
2025-10-29T18:16:05.000000Z
hdfversion :
HDF5 1.14.4
history :
2025-10-29T18:16:05.000000Z;f382a7eb-a47f-31f0-9f2e-73f50aca7262;Created by PGE atlas_l3b_si Version 3.1.1
identifier_file_uuid :
f382a7eb-a47f-31f0-9f2e-73f50aca7262
identifier_product_format_version :
3.1.
time_coverage_duration :
2675948.0
time_coverage_end :
2019-01-01T00:51:32.000000Z
time_coverage_start :
2018-12-01T01:32:24.000000Z
geospatial_lat_min :
46.774238715355445
geospatial_lon_min :
-179.99999991333772
geospatial_lat_max :
88.04551171979564
geospatial_lon_max :
179.99999979309604
publisher_name :
NSIDC DAAC > NASA National Snow and Ice Data Center Distributed Active Archive Center
Cite these data in publications as follows: The data used in this study were produced by the ICESat-2 Science Project Office at NASA/GSFC. The data archive site is the NASA National Snow and Ice Data Center Distributed Active Archive Center.
processing_level :
3B
references :
http://nsidc.org/data/icesat2/data.html
project :
ICESat-2 > Ice, Cloud, and land Elevation Satellite-2
instrument :
ATLAS > Advanced Topographic Laser Altimeter System
platform :
ICESat-2 > Ice, Cloud, and land Elevation Satellite-2
source :
Spacecraft
Specify a open_method profile
Now that we know what the groups are and what the latitude and longitude are called, we can set up a open_method profile. This is used to tell point-collocation how to open the file (open_dataset or open_datatree and what groups (if any) to merge. Note, open_dataset and merge is faster than open_datatree and merge.
Let's open one file and plot our points on that data. A bunch of points are on land and those will be NaN. A few points are on white (NaN) and those will be NaN also.
PROJCS["NSIDC Sea Ice Polar Stereographic North",GEOGCS["Unspecified datum based upon the Hughes 1980 ellipsoid",DATUM["Not_specified_based_on_Hughes_1980_ellipsoid",SPHEROID["Hughes 1980",6378273,298.279411123061,AUTHORITY["EPSG","7058"]],AUTHORITY["EPSG","6054"]],PRIMEM["Greenwich",0,AUTHORITY["EPSG","8901"]],UNIT["degree",0.0174532925199433,AUTHORITY["EPSG","9122"]],AUTHORITY["EPSG","4054"]],PROJECTION["Polar_Stereographic"],PARAMETER["latitude_of_origin",70],PARAMETER["central_meridian",-45],PARAMETER["scale_factor",1],PARAMETER["false_easting",0],PARAMETER["false_northing",0],UNIT["metre",1,AUTHORITY["EPSG","9001"]],AXIS["X",EAST],AXIS["Y",NORTH],AUTHORITY["EPSG","3411"]]
description :
Coordinate reference system identification for NSIDC Sea Ice Polar Stereographic (Hughes ellipsoid).
Gridded map which describes each grid cell as land (=1) or ocean/sea ice (=0)
grid_mapping :
crs
long_name :
land mask map
source :
Sea Ice ATBD
units :
1
valid_max :
1
valid_min :
0
Array
Chunk
Bytes
1.04 MiB
1.04 MiB
Shape
(448, 304)
(448, 304)
Dask graph
1 chunks in 2 graph layers
Data type
float64 numpy.ndarray
delta_time_beg
(phony_dim_0)
datetime64[ns]
dask.array<chunksize=(1,), meta=np.ndarray>
contentType :
modelResult
description :
Center time of the first reference surface used in this gridded composite in seconds since the ATLAS SDP GPS Epoch. The ATLAS Standard Data Products (SDP) epoch offset is defined within /ancillary_data/atlas_sdp_gps_epoch as the number of GPS seconds between the GPS epoch (1980-01-06T00:00:00.000000Z UTC) and the ATLAS SDP epoch. By adding the offset contained within atlas_sdp_gps_epoch to delta time parameters, the time in gps_seconds relative to the GPS epoch can be computed.
long_name :
Elapsed GPS seconds
source :
Derived via Time Tagging
standard_name :
time
Array
Chunk
Bytes
8 B
8 B
Shape
(1,)
(1,)
Dask graph
1 chunks in 2 graph layers
Data type
datetime64[ns] numpy.ndarray
delta_time_end
(phony_dim_0)
datetime64[ns]
dask.array<chunksize=(1,), meta=np.ndarray>
contentType :
modelResult
description :
Center time of the last reference surface used in this gridded composite in seconds since the ATLAS SDP GPS Epoch. The ATLAS Standard Data Products (SDP) epoch offset is defined within /ancillary_data/atlas_sdp_gps_epoch as the number of GPS seconds between the GPS epoch (1980-01-06T00:00:00.000000Z UTC) and the ATLAS SDP epoch. By adding the offset contained within atlas_sdp_gps_epoch to delta time parameters, the time in gps_seconds relative to the GPS epoch can be computed.
long_name :
Elapsed GPS seconds
source :
Derived via Time Tagging
standard_name :
time
Array
Chunk
Bytes
8 B
8 B
Shape
(1,)
(1,)
Dask graph
1 chunks in 2 graph layers
Data type
datetime64[ns] numpy.ndarray
mean_ssha
(grid_y, grid_x)
float32
dask.array<chunksize=(448, 304), meta=np.ndarray>
contentType :
modelResult
description :
Monthly mean sea surface height anomalies (SSHA) for each monthly grid cell. Sea surface height anomalies expressed relative to the mean sea surface (other geophysical corrections also applied, as indicated in the ATBD) calculated as the mean of all available daily mean_ssha values.
grid_mapping :
crs
long_name :
Monthly mean sea surface height anomalies
source :
Sea Ice ATBD
units :
meters
Array
Chunk
Bytes
532.00 kiB
532.00 kiB
Shape
(448, 304)
(448, 304)
Dask graph
1 chunks in 2 graph layers
Data type
float32 numpy.ndarray
mean_weighted_earth_free2mean
(grid_y, grid_x)
float32
dask.array<chunksize=(448, 304), meta=np.ndarray>
contentType :
modelResult
description :
Mean monthly solid earth permanent tide correction calculated from all available daily mean_weighted_earth_free2mean values. Subtract from mean_ssha to remove the solid earth permanent tide.
grid_mapping :
crs
long_name :
Monthly mean solid earth tide free-to-mean conversion
source :
Sea Ice ATBD
standard_name :
solid earth tide free2mean
units :
meters
Array
Chunk
Bytes
532.00 kiB
532.00 kiB
Shape
(448, 304)
(448, 304)
Dask graph
1 chunks in 2 graph layers
Data type
float32 numpy.ndarray
mean_weighted_geoid
(grid_y, grid_x)
float32
dask.array<chunksize=(448, 304), meta=np.ndarray>
contentType :
modelResult
description :
Mean monthly geoid calculated from all available daily mean_weighted_geoid values. Geoid is expressed relative to the WGS-84 reference ellipsoid from EGM2008 and is in a mean-tide system.
grid_mapping :
crs
long_name :
Monthly mean geoid
source :
Sea Ice ATBD
units :
meters
Array
Chunk
Bytes
532.00 kiB
532.00 kiB
Shape
(448, 304)
(448, 304)
Dask graph
1 chunks in 2 graph layers
Data type
float32 numpy.ndarray
mean_weighted_geoid_free2mean
(grid_y, grid_x)
float32
dask.array<chunksize=(448, 304), meta=np.ndarray>
contentType :
modelResult
description :
Mean monthly geoid free-to-mean correction calculated from all available daily mean_weighted_geoid values. Subtract from mean_weighted_mss or mean_weighted_geoid to covert to a tide-free system.
grid_mapping :
crs
long_name :
Monthly mean geoid free-to-mean conversion
source :
Sea Ice ATBD
standard_name :
geoid free2mean
units :
meters
Array
Chunk
Bytes
532.00 kiB
532.00 kiB
Shape
(448, 304)
(448, 304)
Dask graph
1 chunks in 2 graph layers
Data type
float32 numpy.ndarray
mean_weighted_mss
(grid_y, grid_x)
float32
dask.array<chunksize=(448, 304), meta=np.ndarray>
contentType :
modelResult
description :
Mean monthly MSS calculated from all available daily mean_weighted_mss values. MSS is expressed relative to the WGS-84 reference ellipsoid from a DTU/CS-2 merged product (https://doi.org/10.5281/zenodo.4294047) and is in a mean-tide system.
grid_mapping :
crs
long_name :
Monthly mean MSS
source :
Sea Ice ATBD
units :
meters
Array
Chunk
Bytes
532.00 kiB
532.00 kiB
Shape
(448, 304)
(448, 304)
Dask graph
1 chunks in 2 graph layers
Data type
float32 numpy.ndarray
n_refsurfs
(grid_y, grid_x)
float64
dask.array<chunksize=(448, 304), meta=np.ndarray>
contentType :
modelResult
description :
Number of reference surface sections used in each monthly grid cell
grid_mapping :
crs
long_name :
Monthly population count
source :
Sea Ice ATBD
units :
1
Array
Chunk
Bytes
1.04 MiB
1.04 MiB
Shape
(448, 304)
(448, 304)
Dask graph
1 chunks in 2 graph layers
Data type
float64 numpy.ndarray
sigma
(grid_y, grid_x)
float32
dask.array<chunksize=(448, 304), meta=np.ndarray>
contentType :
modelResult
description :
Standard deviation of monthly gridded mean sea surface height anomaly, computed following ATBD section 6.3.
grid_mapping :
crs
long_name :
Monthly standard deviation
source :
Sea Ice ATBD
units :
meters
Array
Chunk
Bytes
532.00 kiB
532.00 kiB
Shape
(448, 304)
(448, 304)
Dask graph
1 chunks in 2 graph layers
Data type
float32 numpy.ndarray
short_name :
ATL21
level :
L3B
description :
This data set (ATL21) contains daily and monthly gridded polar sea surface height anomalies
Conventions :
CF-1.7
contributor_name :
Alek Petty (alek.a.petty@nasa.gov), Ron Kwok (rkwok01@uw.edu), Marco Bagnardi (marco.bagnardi@nasa.gov), Nathan Kurtz (nathan.t.kurtz@nasa.gov), Jeff Lee (jeffrey.e.lee@nasa.gov), Jesse Wimert (jesse.wimert@us.kbr.com), David Hancock (david.w.hancock@nasa.gov)
Data may not be reproduced or distributed without including the citation for this product included in this metadata. Data may not be distributed in an altered form without the written permission of the ICESat-2 Science Project Office at NASA/GSFC.
naming_authority :
http://dx.doi.org
spatial_coverage_type :
Horizontal
standard_name_vocabulary :
CF-1.6
time_type :
CCSDS UTC-A
date_created :
2025-10-29T18:15:34.000000Z
hdfversion :
HDF5 1.14.4
history :
2025-10-29T18:15:34.000000Z;15ffb2f7-da47-325b-84ea-12bd9391535c;Created by PGE atlas_l3b_si Version 3.1.1
identifier_file_uuid :
15ffb2f7-da47-325b-84ea-12bd9391535c
identifier_product_format_version :
3.1.
time_coverage_duration :
2596732.0
time_coverage_end :
2018-12-01T01:32:24.000000Z
time_coverage_start :
2018-11-01T00:13:32.000000Z
geospatial_lat_min :
47.02978808936284
geospatial_lon_min :
-179.9999975220856
geospatial_lat_max :
88.0454824903494
geospatial_lon_max :
179.99999923041685
publisher_name :
NSIDC DAAC > NASA National Snow and Ice Data Center Distributed Active Archive Center
Cite these data in publications as follows: The data used in this study were produced by the ICESat-2 Science Project Office at NASA/GSFC. The data archive site is the NASA National Snow and Ice Data Center Distributed Active Archive Center.
processing_level :
3B
references :
http://nsidc.org/data/icesat2/data.html
project :
ICESat-2 > Ice, Cloud, and land Elevation Satellite-2
instrument :
ATLAS > Advanced Topographic Laser Altimeter System
platform :
ICESat-2 > Ice, Cloud, and land Elevation Satellite-2
source :
Spacecraft
Specify spatial_method="xoak-haversine"
If we plot the points, we see that they are clustered around the North Pole. A kdtree, treates lat/lon as if they are euclidian, but near the pole 1 degree of latitude is very different than 1 degree of longitude. Thus kdtrees do poorly near the poles. Instead, we can use a Ball tree with the haversine metric.
importmatplotlib.pyplotaspltimportcartopy.crsasccrsimportcartopy.featureascfeatureimportnumpyasnpfig=plt.figure(figsize=(8,8))ax=plt.axes(projection=ccrs.NorthPolarStereo())# plot the fieldds.mean_ssha.plot.pcolormesh(x="grid_lon",y="grid_lat",transform=ccrs.PlateCarree(),ax=ax,shading="auto",add_colorbar=True,)ax.coastlines()ax.add_feature(cfeature.LAND,facecolor="lightgray")# Arctic extentax.set_extent([-180,180,50,90],crs=ccrs.PlateCarree())# gridlinesgl=ax.gridlines(crs=ccrs.PlateCarree(),draw_labels=True,linewidth=0.8,color="gray",alpha=0.6,linestyle="--",)gl.top_labels=Falsegl.right_labels=Falsegl.xlocator=plt.FixedLocator(np.arange(-180,181,30))gl.ylocator=plt.FixedLocator(np.arange(50,91,10))# ---- add points from dataframe ----ax.scatter(df.lon,df.lat,transform=ccrs.PlateCarree(),s=15,color="red",edgecolor="black",zorder=10,)plt.show()
%%time# this takes about 2 minutesres=pc.matchup(plan,variables=["mean_ssha"],open_method=icesat2_atl21,spatial_method="xoak-haversine")
CPU times: user 1min 39s, sys: 300 ms, total: 1min 39s
Wall time: 1min 46s
The full res output shows the granules and granules closest lat/lon. Here is just the matchups.